One property. Every pound shown.
We follow one reference property all the way through: a refurbished two-bedroom house in .
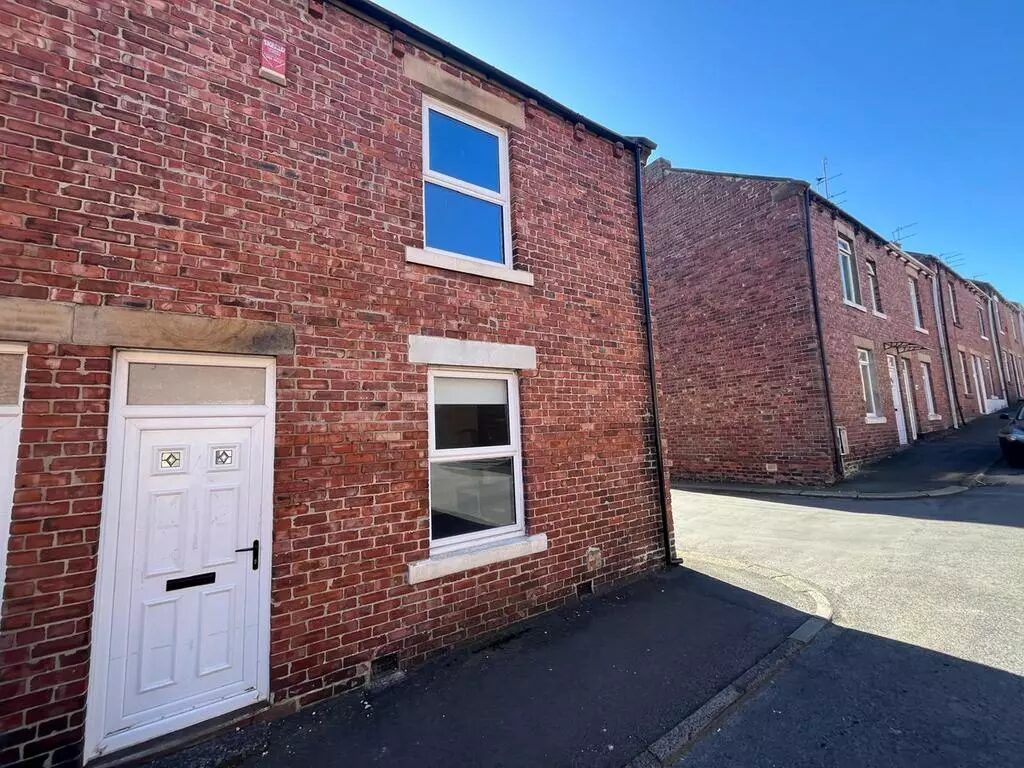 REFERENCE EXAMPLE
The figures are modelled at 70% occupancy. Myshon's sample ran at 99%.
Because income passes through, drives what reaches you. Here are Myshon's modelled levels, from about 10% up to about 19.5% at the 99% sample level, for a two-bed home.
| MODELLED OCCUPANCY | RUNNING YIELD | PER YEAR | PER MONTH | AGAINST 12% TARGET |
|---|---|---|---|---|
| ≈54%LOWER CASE | ≈10.0% | ≈£12,740 | ≈£1,062 | −2.0 pts |
| 12% target | 12.0% | £15,288 | £1,274 | Target income |
| 70%MODELLED SCENARIO | 13.4% | £17,026 | £1,419 | +1.4 pts |
| 85%HIGHER CASE | 16.6% | £21,148 | £1,762 | +4.6 pts |
| 99%HISTORICAL SAMPLE LEVEL* | ≈19.5% | ≈£24,843 | ≈£2,070 | +7.5 pts |
Myshon's modelled occupancy points for the two-bed reference home (£127,400), after modelled costs. Yearly figure = running yield × £127,400; monthly = yearly ÷ 12; rounded to the nearest pound. ≈ marks a rounded brochure value. *Myshon Occupancy Analysis, 600-unit transitional-housing sample over 12 months, May 2025. Past occupancy does not predict future occupancy. Target returns are not guaranteed.
The income, the costs and the residual.
Modelled occupancy scenario. £2,174.00 − £755.20 = £1,418.80 a month; × 12 = £17,025.60; ÷ £127,400 = 13.36%. Rounded to the nearest pound and 0.1%. Reference example only, not live availability.
Own the property. Understand the income.
Request the property pack for a home you like, and we introduce you to an independent broker or IFA who walks you through the numbers. No obligation.